IMAGE RESIZER / REPEATED RESAMPLING
Does resizing an image twice give the same result as once?
The final width and height can match while the pixels differ. A second resize filters an already changed grid. For a predictable final export, keep the original and resize from it to your target dimensions. Our downloadable line-chart test compares one-step and two-step reductions with the same filter; it measures pixel differences, not a universal quality score.
Separate the export path from the final dimensions
A file labeled 96 × 72 does not tell you whether it came directly from the original or from an intermediate copy. Each path can use different sample locations and different intermediate rounding. Saving intermediate JPEGs adds another variable, so use a lossless format when isolating resampling.
One chart, two routes to 96 × 72
We drew our own 257 × 193 RGB chart: thin black vertical lines in the upper region, horizontal lines below them and teal diagonals on the right. The source contains no transparency or camera metadata. The direct route resizes it to 96 × 72. The other route first produces 160 × 120, then reduces that intermediate grid to the same 96 × 72 target.
We ran both routes separately with Bilinear, Bicubic and Lanczos in Pillow 12.3.0. Each pair uses the same named filter for every resize. We added no sharpening, color conversion or JPEG encoding. All saved outputs are PNG. The intermediate dimensions are explicit rather than inferred from a percentage slider; small aspect-ratio rounding is part of these specified dimensions in both routes.
| Filter | Changed pixels | Mean absolute channel difference | Largest channel difference |
|---|---|---|---|
| Bilinear | 4,554 / 6,912 | 81,502 / 20,736 = 3.9305 | 21 |
| Bicubic | 4,602 / 6,912 | 78,646 / 20,736 = 3.7927 | 26 |
| Lanczos | 4,813 / 6,912 | 119,463 / 20,736 = 5.7611 | 31 |
Read the numbers without turning them into a quality claim
Each final grid contains 96 × 72 = 6,912 pixels and three color channels per pixel, giving 20,736 channel samples. We count a pixel as changed if at least one saved RGB channel differs between the routes. For the mean, we sum the absolute channel differences and divide by 20,736. The table shows the actual numerator as well as that shared denominator, so you can recompute each displayed mean.
For example, identical pixels contribute zero to the sum. A red-channel difference of five contributes five, irrespective of whether that change looks better to a viewer. The largest difference is the biggest absolute disagreement in any one channel. Neither statistic identifies which route is aesthetically preferable. The direct output is a comparison reference, not a ground-truth reconstruction of a smaller scene.
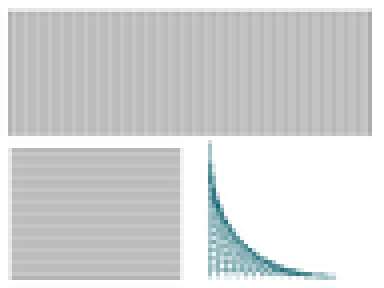
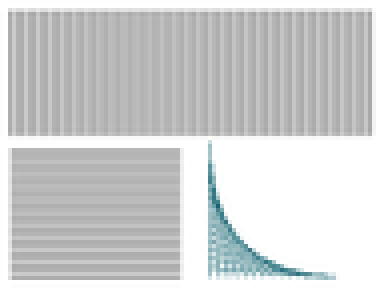
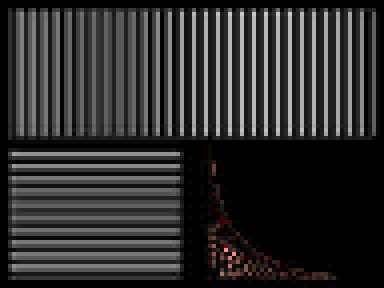
The three previews enlarge the saved 96 × 72 outputs fourfold using nearest-neighbor display pixels. That enlargement makes individual samples inspectable without introducing another smoothing filter. The difference view deliberately amplifies changes; it is not how either normal output looks. Download the small originals to judge them at their actual display size.
Download and repeat the exact comparison
Start with our 257 × 193 source. For the Lanczos example, keep the direct output, 160 × 120 intermediate and two-stage output separate. Compare decoded RGB values, not compressed file sizes. We reloaded our saved PNGs and independently summed the integer channel differences to check the table.
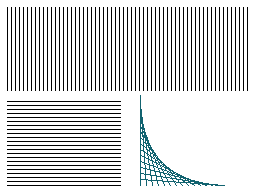

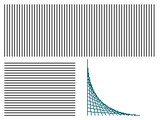

This experiment uses one synthetic chart and fixed dimensions. It does not test a photograph, an enlargement, an online competitor or a pipeline that sharpens between stages. Changing any of those inputs would require a new measurement. The result establishes that equal dimensions and equal filter names do not guarantee identical pixels after different resize routes.
Does a second resize always make an image look worse?
No universal verdict follows from this comparison. Visibility depends on content, viewing size and the actual processing pipeline. Keep a direct export as your control when evaluating an intermediate workflow, and compare like-for-like sharpening and compression settings.
What if I only have the smaller intermediate file?
You can still resize that file, but cannot recover discarded source detail merely by choosing the original dimensions again. Keep it as the available input and label the export path accurately. If the original is available later, make another final-size export from it for comparison.
Preserve the source and record the route. The dimensions describe the destination; the sequence of resizes helps explain how its pixels were produced.
More image resizing experiments →